
2015 Phase 1 << Back
The aim of this phase was to characterize the
ambient seimc noise recorded at two seismic arrays that are part
of the Romanian Seismic Network and installed in Romania, one in
the Northern part of the country - Bucovina (BURAR) array and
one in the Vrancea seismic zone - Plostina (PLOR) array (Figure
1). The noise level was analyzed in different frequency bands as
a function of time of day and season. Investigation of the
influence of noise variations on the stations detection
capability of the two networks was also performed. Only part of
the results obtained in this phase are presented bellow.
The BURAR array consists of
ten stations with seismic sensors installed in boreholes at
depths of 30 and 50 m, covering an area of 5x5 km2.
Nine stations are equipped with GS21 short period vertical
sensors and one station has a 3-component broadband sensor
(KS54000). In 2008, three more 3-component broadband sensors
(CMG-40T) were installed at surface; two of them collocated with
existing sites and one in a different site. The PLOR array
consists of 7 elements equipped with 3-component broadband
sensors (CMG40T – 6 and STS2 – 1). The aperture of the array is
2.5 km, with a distance between inner elements of 250 m and 1100
m for the outer elements.
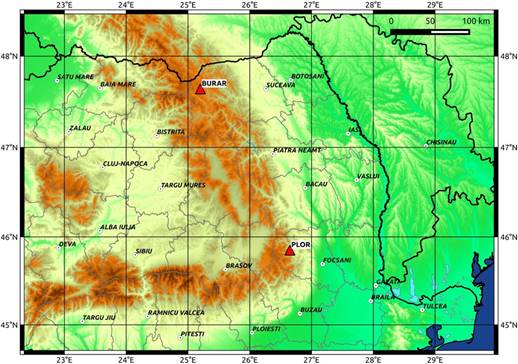
Figure 1.
Map with the locations of the two ararys (red triangles)
The data used for the
analysis consisted of the continuous waveforms recorded between
January 2010 and September 2015 at the BURAR and PLOR arrays.
To investigate the noise
level at the seismic stations we computed the Probability
Density Functions (PDFs) (Figure 2) following the procedure
described by McNamara and Boaz (2005).
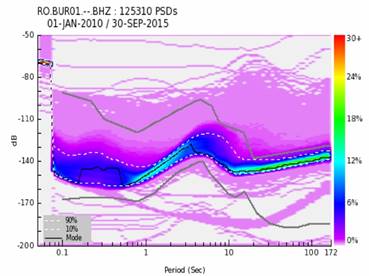
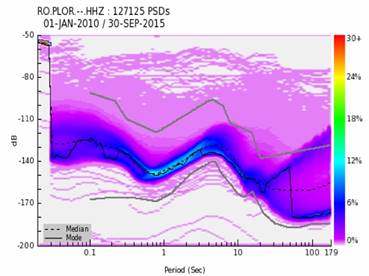
Figure 2. PDFs for the vertical component of stations
BUR01 (SHZ) and PLOR (HHZ) computed for 125310, respectively
127125 power spectral densities (PSDs)
Seismic noise has different
sources. At high frequencies (> 1 Hz), seismic noise has mainly
anthropogenic origin and is generated by the coupling of the man
and man-made machinery (power plants, factories, highways, etc)
energy into the Earth. The level of the high frequency seismic
noise is different from one site to another, depending on
the source and distance to the source.
We investigated the
variations of the noise level between daytime and nighttime by
computing the median of the PDF for each hour of the day over
the entire period (2010 -2015). The results showed important
diurnal variations, up to 42 dB, for all stations.
As an example, in Figure 3 is shown the noise level variation
between daytime and nightime observed at station BUR01. One can
notice that, in the frequency band 2-7 Hz, the
level of ambient seismic noise is highest in the time interval 6
a.m. – 2 p.m.
Figure 3. Diurnal
variation of ambient noise observed in the frequency band 1-12
Hz at station BUR01 (vertical component SHZ)
In the microseismic band
(2-20 s), seismic noise has natural origin, being associated
with the interaction between ocean waves and the sea floor. It
is characterized by two spectral peaks: the first one is
observed in the domain 2-10s and is called Double Frequency Peak
(DFP), while the second one is observed around 14 s and is
called Single Frequency Peak (SFP). The amplitude of the DFP is
much larger than the amplitude of SFP.
To investigate the
dependency of the noise level on the season in the secondary
microseismic domain (2-10 s) we computed the median of the PSD
for three months intervals, from March 2010 to August 2015. We
considered the months of December, January, and February as
winter months, March, April, and May as spring months, June,
July, and August as summer months, and September, October, and
November as fall months. For all stations the seasonal
variations are clearly seen in the secondary microseismic band.
The noise power levels are lowest during summer and highest
during winter, while during spring and fall the noise level is
very similar and in-between the first two. We also noted that
the maximum of the DFP shifts from smaller periods in summer to
higher periods in winter (Figure 4).
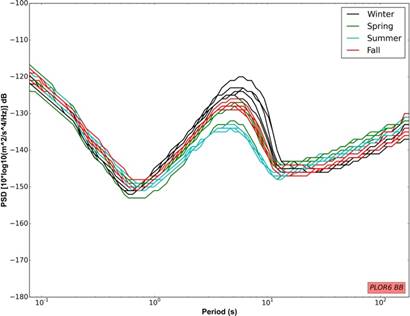
Figura 4.
Seasonal variations obesrved at station PLOR6
The waveforms of the local earthquakes recorded at PLOR and BURAR arrays stations are dominated by high frequencies (> 1Hz), therefore the noise variations observed in this frequency domain affect the detection capability of these stations, especially for earthquakes with magnitudes ML ≤ 3.5. To understand the way the diurnal variations influence the detection capability of the stations, in Figure 5 are shown the waveforms of two earthquakes of magnitude ML= 3.5 recorded at stations BUR08. The hipocentral parameters of the events are very similar (longitude, latitude, depth), while the time of the occurrence is different, one event being produced during the night and the other during the day. The PSDs computed for time windows of 30 minutes lengths including the two earthquakes are also shown in the figure together with the median PDF of the station and the median PDF computed for daytime, respectively nighttime. It can be noticed that for the night event the signal to noise ratio is higher than for the event occurred during the day. Furthermore, the PSD of the earthquake occurred during the night is situated above the median PDF of the station, whilst the PSD of the event occurred during the day is very close to the median PDF of the station and the median of the PDF computed for the daytime.
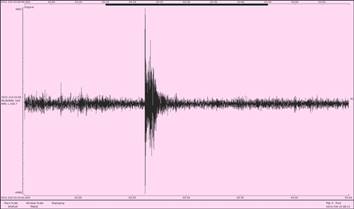
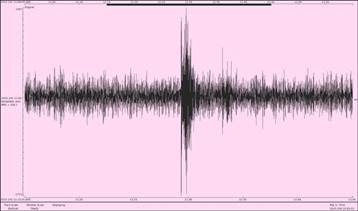
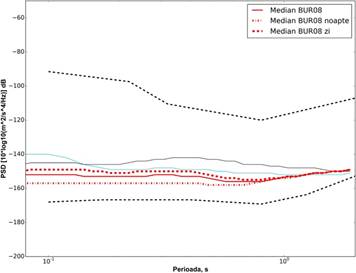
Figure 5. The waveforms of two earthquakes of
the same magnitude that occurred in the same place during the
night (upper left) and during the day (upper right) and recorded
at station BUR08. Down – the PSDs of the two events,
light blue – daytime event, black – nighttime event
References
2016 Phase 2
The second phase
focussed on the analysis of seismic noise as recorded by the
arrays used in the project - BURAR, PLOR, SCP and URS (Figure 1)
- and aimed, on one hand, to estimate the influence of the noise
variations on the H/V ratios in Bucharest area and, on the other
hand, to identify the directions to the sources responsible for
generating the seismic noise in different frequency bands. The
data used in the analysis covered different time intervals:
November 2003 – August 2004 for URS array, July 2009 – June 2011
for SCP array and January 2011 – December 2015 for BURAR and
PLOR arrays.
<< Back