
2015 Phase 1
The aim of this phase was to characterize the
ambient seimc noise recorded at two seismic arrays that are part
of the Romanian Seismic Network and installed in Romania, one in
the Northern part of the country - Bucovina (BURAR) array and
one in the Vrancea seismic zone - Plostina (PLOR) array (Figure
1). The noise level was analyzed in different frequency bands as
a function of time of day and season. Investigation of the
influence of noise variations on the stations detection
capability of the two networks was also performed. Only part of
the results obtained in this phase are presented bellow.
2016 Phase 2 << Back
The second phase
focussed on the analysis of seismic noise as recorded by the
arrays used in the project - BURAR, PLOR, SCP and URS (Figure 1)
- and aimed, on one hand, to estimate the influence of the noise
variations on the H/V ratios in Bucharest area and, on the other
hand, to identify the directions to the sources responsible for
generating the seismic noise in different frequency bands. The
data used in the analysis covered different time intervals:
November 2003 – August 2004 for URS array, July 2009 – June 2011
for SCP array and January 2011 – December 2015 for BURAR and
PLOR arrays.
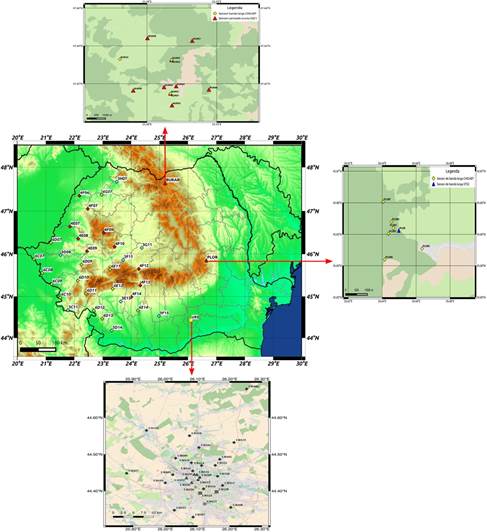
Figure1.
Map with arrays locations and arrays stations distributions
The noise variations in
Bucharest area have been studied at URS stations in two
frequency bands: the first one corresponding to the microseisms
(0.05 – 0.5 Hz) and the second one corresponding to the domain
where the seismic noise has mainly anthropogenic origin (0.5 –
25 Hz). In the microseismic band the observed noise variations
are due to natural factors (such as storms in the Black Sea),
while in the high frequency band they are generated by anthropic
activities. Once the variations identified,
we investigated how they influence the amplitude and frequency
of the spectral peaks of H/V ratios (Figure 2).
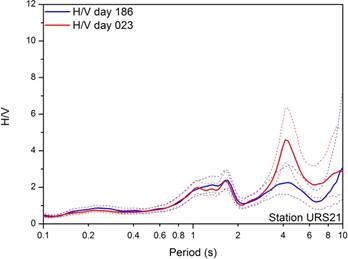
Figure 2.
The H/V ratios computed for two different days at station URS21.
An increase of the noise level during the winter day (julian day
023) affects the spectral peak observed at larger periods
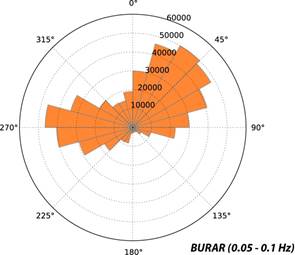
Figure 3.
Rose diagrams with station particle
motion back azimuths in the frequency band 0.05 – 0.1 Hz
obtained for five years of data (2011-2015)
 \
\
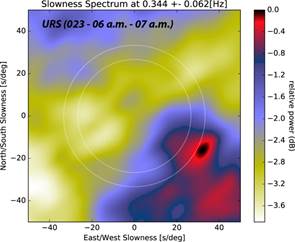
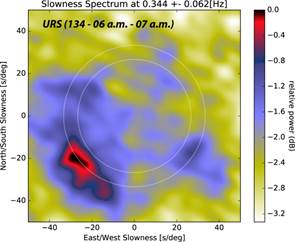
Figure 4. Results of IAS Capon analysis
for two different time periods (23rd of January 2004 and
4th of July 2004)
References
Capon, J., 1969. High-resolution
frequency-wavenumber spectrum analysis, Proc. IEEE, 57(8),
1408–1418.
Gal, M., Reading, a. M., Ellingsen,
S. P., Koper, K. D., Gibbons, S. J., & Nasholm, S. P. (2014).
Improved implementation of the fk and Capon methods for array
analysis of seismic noise.
Schimmel M, Stutzmann E,
Ardhuin,F, and Gallart J (2011) Polarized Earth's ambient
microseismic noise. Geochemistry, Geophysics, Geosystems, 12(7).
2017 Phase 3
The third phase focused on several aspects related to the seismic noise recorded by the stations used in the project: i) analysis of correlations between background seismic noise and sea level data ii) analysis of the characteristics of the noise cross-correlations obtained at ‘small scale’ (interstation distances between 2 and 60 km) and ‘large scale’ (interstation distances between 100 and 500 km) iii) noise based monitoring of two seismic areas (Vrancea and Galati)
<< Back