2015 Phase 1
The aim of this phase was to characterize the
ambient seimc noise recorded at two seismic arrays that are part
of the Romanian Seismic Network and installed in Romania, one in
the Northern part of the country - Bucovina (BURAR) array and
one in the Vrancea seismic zone - Plostina (PLOR) array (Figure
1). The noise level was analyzed in different frequency bands as
a function of time of day and season. Investigation of the
influence of noise variations on the stations detection
capability of the two networks was also performed. Only part of
the results obtained in this phase are presented bellow.
2016 Phase 2
The second phase
focussed on the analysis of seismic noise as recorded by the
arrays used in the project - BURAR, PLOR, SCP and URS (Figure 1)
- and aimed, on one hand, to estimate the influence of the noise
variations on the H/V ratios in Bucharest area and, on the other
hand, to identify the directions to the sources responsible for
generating the seismic noise in different frequency bands. The
data used in the analysis covered different time intervals:
November 2003 – August 2004 for URS array, July 2009 – June 2011
for SCP array and January 2011 – December 2015 for BURAR and
PLOR arrays.
2017 Phase 3
The third phase focused on several aspects
related to the seismic noise recorded by the stations used in
the project: i) analysis of correlations between background
seismic noise and sea level data ii) analysis of the
characteristics of the noise cross-correlations obtained at
‘small scale’ (interstation distances between 2 and 60 km) and
‘large scale’ (interstation distances between 100 and 500 km)
iii) noise based monitoring of two seismic areas (Vrancea and
Galati)
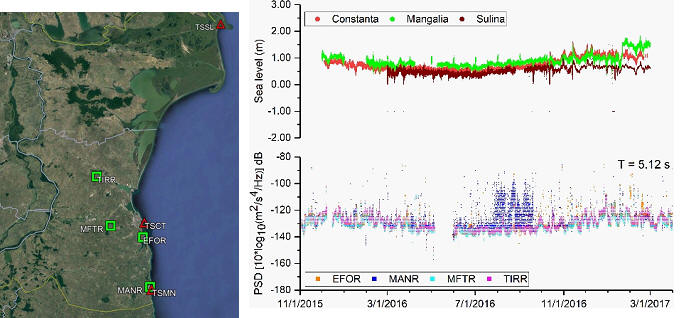
i)
We used four seismic stations (EFOR,
MANR, MFTR and TIRR) and three sea level stations (TSCT, TSMN
and TSSL) to investigate the correlations between seismic noise
and sea level data. The analysis was performed for the time
interval December 2015-March 2017 (Figure 1)

Figure 1. Stations locations (red triangle
– sea level station, green square – seismic station) and
comparison between the sea level data and the level of seismic
noise obtained for the period 5.12 s
ii)
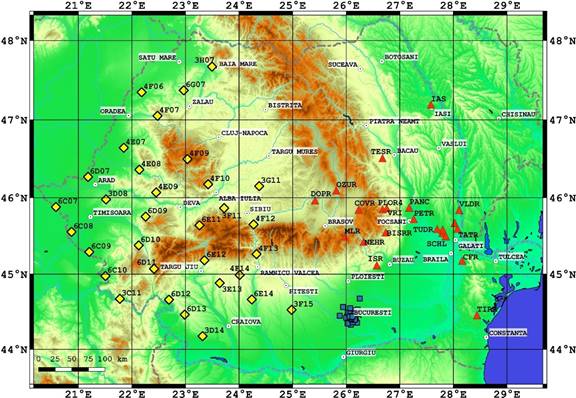
We investigated the characteristics of
the noise cross correlations computed between: the seismic
stations deployed in Bucharest area during a temporary
experiment (URban Seismology - URS stations), seismic stations
in installed in Vrancea (BISRR, COVR, MLR, NEHR,
PANC, PETR, PLOR si VRI) and Galati (CFR,
IZVR, SCHL, SCTR, SLCR, TATR, TUDR, VLDR) areas, seismic
stations deployed within the Southern Carpathian Project (SCP
stations) and the following seismic stations of the Romanian
Seismic Network: CFR, DOPR, IAS, ISR, MLR, OZUR, PETR, PLOR$,
TESR, TIRR, VRI (Figure 2).

Figure 2. Map with the stations locations used to compute the
noise cross correlations (blue squares – URS stations, yellow
diamonds – SCP stations, red triangles – RSN stations)
The analyses were performed in different frequency bands: 0.3 –
1 Hz and 1 – 5 Hz for the stations with interstation distances
between 2 and 60 km, 0.05 – 0.5 Hz for stations with
interstation distances larger than 100 km. We studied the
influence of the anthropogenic and seasonal noise variations on
the cross –correlations and their corresponding dispersion
curves.


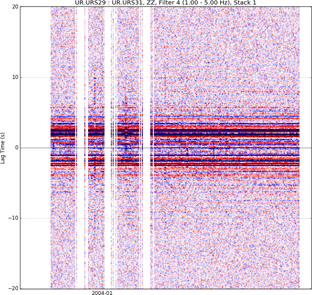
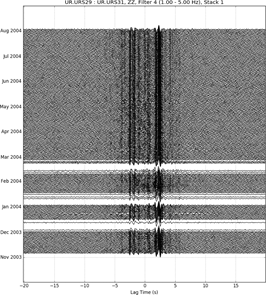
Figure 3. The interferogram and daily cross-correlation
functions obtained for the URS station pair URS29-URS31 in the
frequency band 1 – 5 Hz
iii)
We have implemented the
MSNoise package (Lecocq et al., 2014) to monitor two active
seismic areas (Vrancea and Galati) using ambient seismic noise.
We used the data recorded between 2013 and 2017 by the stations
located around the Vrancea (BISRR, COVR, MLR,
NEHR, PANC, PETR, PLOR si VRI) and Galati (CFR, IZVR, SCHL,
SCTR, SLCR, TATR, TUDR, VLDR) areas.
References
Lecocq, T., Caudron, C., & Brenguier, F.
(2014). MSNoise, a python package for monitoring seismic
velocity changes using ambient seismic noise. Seismological
Research Letters, 85(3), 715-726.
